SPONSORED ARTICLE
An IT network is at the core of the services provided to end users and serves as the foundation for the efficiency of an organization, whether large or small. As networks scale and grow more complex, they become more difficult to manage. A network monitoring tool provides a solution. The process of network monitoring involves gathering relevant data from various parts of a network to efficiently manage and control it.
Challenges in network monitoring
Monitoring and improving network performance isn’t an easy task. Organizations face a number of problems if they don't have the proper network monitoring plan in place to help them improve network performance. Here are some of the network monitoring challenges that your organization might encounter:
- Poor network visibility: Gaining granular visibility into the massive volumes of network performance data produced each day can be a major challenge, especially in distributed network ecosystems. Performance data displayed in dashboards and reports enables network teams to quickly identify and focus on network issues.
- Catching issues too late: You should actively test your network’s performance with proactive network monitoring, which helps you identify faults faster and increase your network uptime and performance.
- Trouble scaling your monitoring tool: Organizations must add or remove processing capacity from their systems to meet demand. Odds are your organization is increasing the scale and complexity of its devices and networks, and your network monitoring solution must be able to keep up.
- Poor network capacity planning: Determining the optimal network capacity and monitoring it as network patterns evolve can be a major challenge.
- Limited alerting: You need to know exactly when and where a problem occurred so you can focus on fixing it. A proactive alerting system that offers real-time alerts ensures you receive alerts well in advance of network issues like failures or performance slowdowns.
What is OpManager?
OpManager is ManageEngine’s end-to-end network management solution for heterogeneous, multi-vendor business IT networks. OpManager can be used to monitor network devices such as switches, routers, servers, load balancers, printers, and storage devices. It also provides WAN and VoIP monitoring, fault management, and performance monitoring for hybrid networks, with support for Nutanix and VMware infrastructure as well as critical applications like Microsoft Hyper-V, Citrix XenServer, and Cisco UCS.
OpManager provides exceptional functionality and accessibility and enables IT teams to obtain comprehensive insights about their IT infrastructure. OpManager customers are represented in the IT services, banking, government, defense, education, health, manufacturing, and logistics sectors.
Features
Network monitoring has three fundamental goals: network availability monitoring, network performance monitoring, and network fault management. Let's go through each one to see how OpManager achieves these goals.
Network availability monitoring
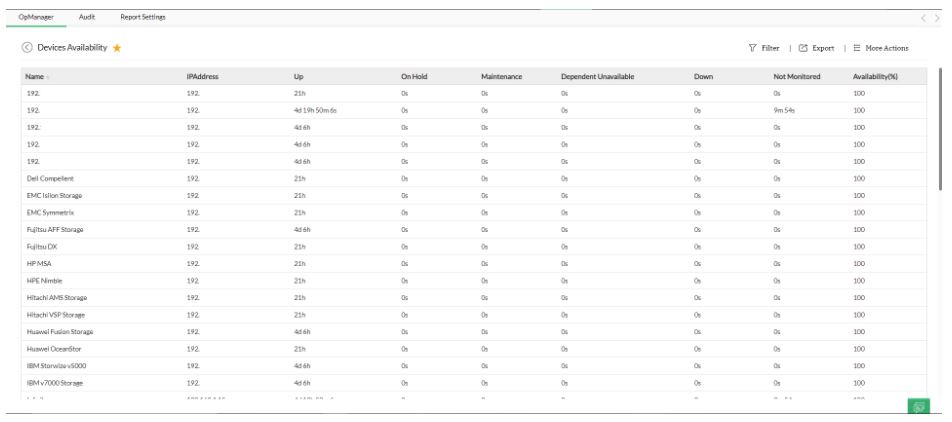
It is vital to monitor the availability of all critical network resources where unavailability would negatively impact your network users. OpManager has different modules that offer monitoring options including device availability, interface and port availability, application and service availability, IP SLA availability, website availability, Windows service availability, and process availability. OpManager's granular availability reports aid in identifying areas of failure and broken links, as well as monitoring all sections of the network. These reports are particularly helpful for organizations that support multiple locations where a localized WAN may be affected and the central IT admin is unaware of the problem.

Network performance monitoring
When it comes to measuring how well a network performs, choosing what to measure is important because there are many variables. Metrics to be measured should be meaningful and cost-effective.
OpManager is cost-effective and designed with the possible losses that organizations might incur in the event of a network outage in mind. The solution enables you to monitor bandwidth utilization, the performance of network services and any IP-based device, and traffic flow. OpManager also has a built-in system to discover and fix CPU or memory issues, packet loss, and server bottlenecks. You can keep track of critical CPU parameters like usage, speed, idle time, and processor time, and OpManager can monitor device traffic as well, enabling you to view interface traffic, filter it by time period, and see the latest traffic value polled.
OpManager monitors availability and response time for business-critical services like DNS, IMAP, HTTPS, and those that run on Oracle platforms. Through SNMP/WMI/CLI, OpManager monitors critical processes running on Windows, Linux, Oracle Solaris, Unix, HP-UX, IBM AIX, VMware ESXi, and other platforms. By offering in-depth visibility of your wireless LAN controller, OpManager's multi-vendor WLC monitoring module helps you keep your network intact. OpManager provides details on WAN link availability, latency, bandwidth usage, round trip time, and other performance variables.
Network fault managementIt often takes longer to figure out the root cause of a problem in the network than it takes to resolve it. OpManager's fault management system deals with this issue by actively monitoring network devices to determine which are active and responding. With its intelligent alarm correlation and color-coded alarms, OpManager helps network administrators quickly identify the root cause of an issue and fix it. When an alarm occurs, OpManager's notification system can send you an SMS or an email.

Thank to its workflow function, OpManager simplifies the process of network alarm management and makes network automations easier for network admins. Workflows are code-free processes that can be quickly designed and implemented by just dragging and dropping the required actions. You can set triggers to activate the workflows. OpManager’s fault management system can also integrate with your help desk, which can assign tickets to the respective network admin through the mapped thresholds set under OpManager.

- OpManager provides complete IT monitoring through a single pane of glass. That includes network, server, and virtual device monitoring; network configuration management; bandwidth monitoring; IP address management; firewall analysis; automatic discovery; fault management; and data center management.
- OpManager comes with customizable dashboards and over 90 widgets that let you turn monitored data into actionable insights.
- OpManager integrates with third-party applications using REST API and integrates with other apps via webhook so you can send messages automatically.
- OpManager, with the help of over 100 built-in reports, helps you gain important insights on network performance. The reports on business views are particularly useful when analyzing the infrastructure needs of a business service or group.
- OpManager is an intuitive network mapping tool. It allows you to generate topology maps, 3D network visualizations of your rack servers, and business views for monitoring important services.
License and pricing model of OpManager
OpManager is an on-premises application that does not require clients to rebuild their networks after they activate the software license. You can evaluate a full-featured version through a free, 30-day trial. A free edition that provides limited features for up to three devices is also available.
However, most organizations today utilize more servers (physical, virtual, or distributed) and require the various features offered in our paid editions. Here are the license and pricing options for OpManager:
Standard edition: This is the basic edition that starts at $245 per 10 devices. It provides the functionality you need for network and physical server monitoring, supported by alarms and notifications, at-a-glance dashboards, and business views.
Professional edition: This edition starts at $345 per 10 devices and includes all the features of the Standard edition, plus expanded capabilities that many organizations find vital today: virtual server monitoring, hardware monitoring, workflow automation, and 3D rack views.
Enterprise edition: This edition starts at $11,545 per 250 devices. It provides more scalability than the Professional edition, with more robust features, such as multi-site/distributed network monitoring and failover.
To learn more about the differences between the OpManager editions,
click here.
System requirements and installation
OpManager is compatible with Linux and Windows operating systems.
Here are the recommended hardware and software requirements for installing OpManager.
Hardware requirements
Note: For 1,000 devices, 5,000 monitors, and 5,000 interfaces with the default monitoring interval and default database retention settings, OpManager utilizes about 1GB of disk space per day. This number may vary based on the entities monitored in your environment and other factors like events generated, syslog, or traps.
Software requirements
OpManager’s installation is simple; there are no pre-installation checks to verify if all system requirements are met. After you've installed the software, the OpManager server will start automatically, and the web interface is launched via the default port, 8060, from your browser. You are immediately presented with a screen that describes a few steps to set up monitoring.
Conclusion
OpManager is a comprehensive network monitoring tool that provides a holistic view of your IT infrastructure, including network devices, servers, and other IT components, as well as performance and fault management. With its user-friendly approach, OpManager enables customers to customize dashboards and reports. Its device-based licensing and affordable price make OpManager the ideal network management solution for organizations of all sizes.